Climate Crisis

Updates

July 2020 - The Local Government Association and the UK Stakeholders for Sustainable Development have launched a guide to help councils engage with the United Nations Sustainable Development Goals (SDGs) at a time when many are starting to re-think the role of local government in leading places and empowering people.

What is Climate Change?

Climate change describes a change in the average conditions — such as temperature and rainfall — in a region over a long period of time and this is something that has been particularly more apparent in the past 20 years, with Earth’s surface warming, so producing many of the warmest years on record.


The developing Climate Change emergency...

Committee on Climate Change suggest that there is good scientific evidence to show the climate is changing because of emissions of greenhouse gases resulting from human activity. The bulk of emissions derive from our demand for energy. The largest contributor is carbon dioxide (CO2), emitted when fossil fuels are burnt to meet those demands. There are also other emissions attached to industrial processes and agriculture.

The Climate Change Act (2008) made the UK the first country to establish a long-term legally binding framework to cut carbon emissions. It contains a target requiring emissions reductions by at least 100% by 2050. To limit the most damaging impacts of climate change, we need to reduce greenhouse gas emissions globally. A wider legal commitment – The Paris Agreement also exists, spanning the UK, the EU and globally, to address climate change.

But it will take more than just legislation to ensure we tackle the problem. Change will involve a combination of new technologies, processes and human behaviour. So what needs to be done?

There are significant benefits of the UK acting now to reduce its emissions:

  • The world has committed to global action on climate change. By reducing its own emissions, the UK is supporting wider international efforts.
  • In a future world where greenhouse gases are restricted, the cost of emitting those gases (i.e. carbon price) will be high. Early action to reduce emissions – here and elsewhere – can help reduce future costs.
  • Investment in and development of low-carbon technologies will put the UK at the forefront of new and expanding global markets.

There will also be a need to adapt to climate change that cannot be avoided. The UK will need to prepare for more flooding, greater pressure on water resources, damage to natural habitats, and risks to human health from heat waves.  At the same time, there could be opportunities, including reduced energy demand and fewer cold-related deaths due to milder winters.

Local committment to this Climate Emergency

Wirral Council has a long held commitment to climate change action and is a signatory to the Climate Local initiative.

In the face of mounting evidence, the council has declared an environment and climate emergency.

For more information visit Climate Emergency on Wirral Council website

Local response to Climate Change

In Wirral, our CO2 emissions have fallen by an average of 3.9% between 2005 and 2017. But we know more needs to be done.

The Cool Wirral Partnership continues to champion and coordinate local action on climate change with the inital Cool 2014-19 climate strategy building valuable relationships and laying the foundations to tackle the climate crisis in Wirral.

This brings us right up to date with Cool 2 strategy that sets Wirral on the path to reach net zero pollution before 2041.

Wirral Council is now finalising a Ten Year Climate Emergency Action Plan 2020-2030 to make the Council and its provision net carbon neutral by 2030.

Wirral Carbon Dioxide (CO2) emissions report (2019)

A review of emissions for Wirral between 2005 and 2016 
Not all carbon emissions are within the scope of influence of local authorities**. Emissions that authorities do not influence include: Motorways; EU Emissions Trading System sites; Diesel railways; Land use, Land Use Change, and Forestry (all emissions belonging to the LULUCF Net Emissions). This report discusses Carbon Dioxide (CO2) emissions on an end-user basis (where emissions are distributed according to the point of energy consumption) assigned to Local Authority areas, as recorded between 2005 and 2016.

Below we explain this climate crisis.


The Climate Crisis Explained in 11 Charts


The Problem

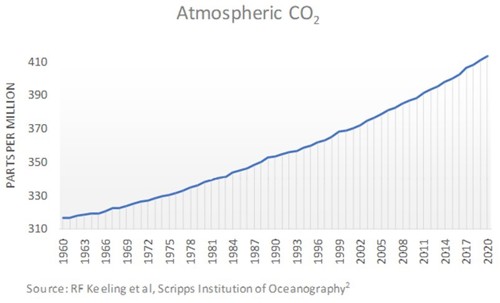
Rising Carbon Dioxide in the Atmosphere

The concentration of CO2 in the Earth’s atmosphere has increased by 48 percent since the beginning of the Industrial Age and 11 percent since year 2000. Once CO2 is added to the atmosphere, it hangs around, for a long time: between 300 to 1,000 years*.

Sources: 
*NASA Global Climate Change https://climate.nasa.gov/news/2915/the-atmosphere-getting-a-handle-on-carbon-dioxide/

Scripps CO2 Program  https://scrippsco2.ucsd.edu/

The Causes

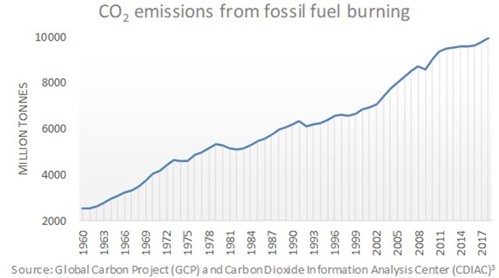
Fossil Fuel Burning

Billions of tonnes of CO2 are sent into the atmosphere every year from coal, oil and gas burning. There is no sign of these emissions starting to fall rapidly, as is needed3.

Source: 3 CDIAC Carbon Dioxide Information Analysis Center https://cdiac.ess-dive.lbl.gov/

Forest Destruction

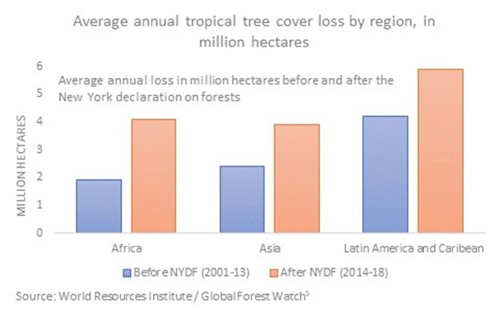
The felling of forests for timber, cattle, soy and palm oil is a big contributor to carbon emissions.

The 2014 New York Declaration on Forests’ (NYFD) overarching goal aims to halve natural forest loss by 2020 and halt it by 2030. The world is not on track to meet this goal. Instead, the average annual global gross tree cover loss has been higher in the years following the adoption of the New York Declaration on Forests, increasing by 43 percent or 7.8 million hectares per year (Mha/yr) compared to a 2001-13 baseline4.

Sources: 

4 Forest declaration New York Declaration on Forests Progress Update https://www.climatefocus.com/publications/progress-new-york-declaration-forests-update-goals-1-9

5 Global Forest Watch https://www.wri.org/our-work/project/global-forest-watch

The Consequences

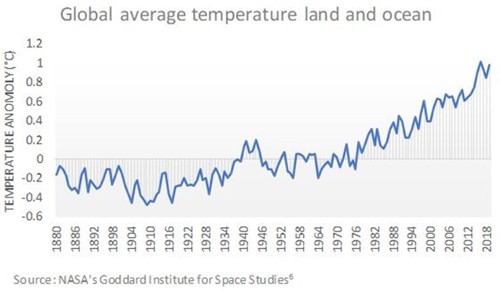
Global Temperature Rise

The planet’s average temperature started to climb steadily two centuries ago but has rocketed since the second world war as consumption and population has risen. Global heating means there is more energy in the atmosphere, making extreme weather events more frequent and more intense. Impacts include fires, droughts, floods, hurricanes and rising seas6.

Source: 6 NASA Goddard Institute for Space Studies https://data.giss.nasa.gov/

Ice Melting in Greenland

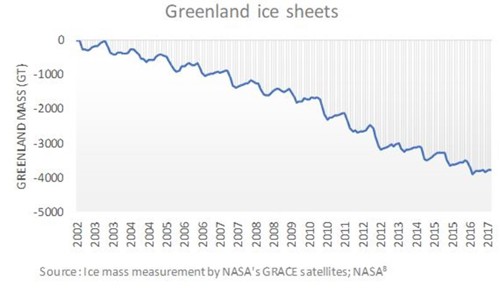
Greenland has lost almost 4 trillion tonnes of ice since 2002. Mountain ranges from the Himalayas to the Andes to the Alps are also losing ice rapidly as glaciers shrink. According to research7 36% of the Himalayan and Hindu Kush ice will melt even if we succeed in limiting global warming to 1.5C. If emissions are not cut, emissions are likely to rise to two-thirds.

Sources: 

7 The Hindu Kush Himalaya Assessment https://link.springer.com/chapter/10.1007/978-3-319-92288-1_7

8 NASA’ GRACE satellites, NASA https://climate.nasa.gov/vital-signs/ice-sheets/

Shrinking Arctic Sea Ice

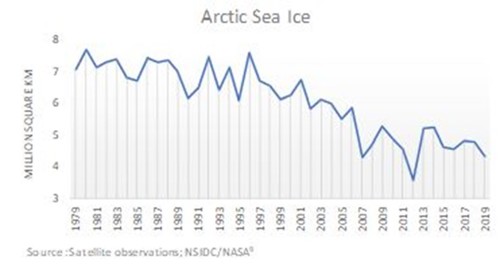
As heating melts the sea ice, the darker water revealed absorbs more of the sun’s heat, causing more heating – one example of the vicious circles in the climate system9.

Source: 9 NSIDC/NASA https://climate.nasa.gov/vital-signs/arctic-sea-ice/

Rising Sea Levels

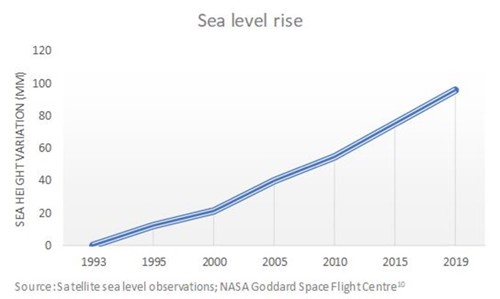
Sea level rise is caused primarily by two factors related to global warming: the added water from melting ice sheets and glaciers and the expansion of seawater as it warms10.

Source: 10 NASA https://climate.nasa.gov/vital-signs/sea-level/

Addressing the Issue

Renewable Energy Consumption

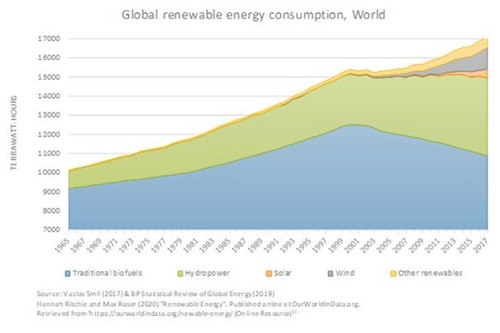
The International Energy Agency (IEA) found that solar, wind and hydropower projects are rolling out at their fastest rate in four years. Global supplies of renewable electricity are growing faster than expected and could expand by 50 percent in the next five years, powered by a resurgence in solar energy. Renewable energy sources make up 26 percent of the world’s electricity today, but according to the International Energy Agency (IEA) its share is expected to reach 30% by 202411.

Source: 11 Our World in Data https://ourworldindata.org/renewable-energy

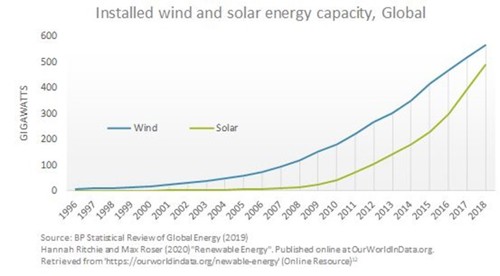
Renewable Energy Consumption – Wind and Solar

Huge cost drops have seen renewable energy become the cheapest energy in many places and the rollout is projected to continue. Analysts also expect coal use to fall. But more action is still required to reach the scale needed and solve difficult problems such as aviation and farming12.

Source: 12 Our World in Data https://ourworldindata.org/renewable-energy#wind-energy

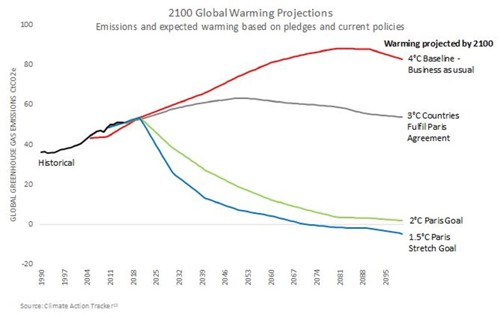
Paris Agreement Climate Change Pledges and Current Policies

Under the framework of the UNFCCC (United Nations Framework Convention on Climate Change) many governments have put forward proposals about how much they intend to reduce their greenhouse-gas emissions in both the near and the long term.

In the absence of policies, global warming is expected to reach 4.1°C – 4.8°C above pre-industrial by the end of the century. Current policies presently in place around the world are projected to reduce baseline emissions and result in about 3.0°C warming above pre-industrial levels13

Source: 13 Climate Action Tracker https://climateactiontracker.org/global/temperatures/

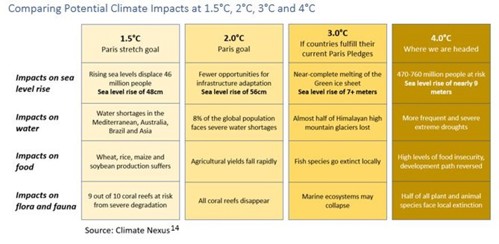
Comparing Potential Climate Impacts at 1.5°C, 2°C, 3°C and 4°C

14 Climate Nexus https://climatenexus.org/

Climate Change - Wirral Intelligence Service - Full document (April 2020)

For more information on Climate Change


This page will be developed with additional international, national and local content over time - please come back and view updates